Wednesday, 20 September 2017

Market Structure & Pricing Decisions

Price determination is one of the most crucial aspects in economics. Business managers are expected to make perfect decisions based on their knowledge and judgment. Since every economic activity in the market is measured as per price, it is important to know the concepts and theories related to pricing. Pricing discusses the rationale and assumptions behind pricing decisions. It analyzes unique market needs and discusses how business managers reach upon final pricing decisions.
It explains the equilibrium of a firm and is the interaction of the demand faced by the firm and its supply curve. The equilibrium condition differs under perfect competition, monopoly, monopolistic competition, and oligopoly. Time element is of great relevance in the theory of pricing since one of the two determinants of price, namely supply depends on the time allowed to it for adjustment.

Market Structure

A market is the area where buyers and sellers contact each other and exchange goods and services. Market structure is said to be the characteristics of the market. Market structures are basically the number of firms in the market that produce identical goods and services. Market structure influences the behavior of firms to a great extent. The market structure affects the supply of different commodities in the market.
When the competition is high there is a high supply of commodity as different companies try to dominate the markets and it also creates barriers to entry for the companies that intend to join that market. A monopoly market has the biggest level of barriers to entry while the perfectly competitive market has zero percent level of barriers to entry. Firms are more efficient in a competitive market than in a monopoly structure.

Perfect Competition

Perfect competition is a situation prevailing in a market in which buyers and sellers are so numerous and well informed that all elements of monopoly are absent and the market price of a commodity is beyond the control of individual buyers and sellers
With many firms and a homogeneous product under perfect competition no individual firm is in a position to influence the price of the product that means price elasticity of demand for a single firm will be infinite.

Pricing Decisions

Determinants of Price Under Perfect Competition

Market price is determined by the equilibrium between demand and supply in a market period or very short run. The market period is a period in which the maximum that can be supplied is limited by the existing stock. The market period is so short that more cannot be produced in response to increased demand. The firms can sell only what they have already produced. This market period may be an hour, a day or a few days or even a few weeks depending upon the nature of the product.

Market Price of a Perishable Commodity

In the case of perishable commodity like fish, the supply is limited by the available quantity on that day. It cannot be stored for the next market period and therefore the whole of it must be sold away on the same day whatever the price may be.

Market Price of Non-Perishable and Reproducible Goods

In case of non-perishable but reproducible goods, some of the goods can be preserved or kept back from the market and carried over to the next market period. There will then be two critical price levels.
The first, if price is very high the seller will be prepared to sell the whole stock. The second level is set by a low price at which the seller would not sell any amount in the present market period, but will hold back the whole stock for some better time. The price below which the seller will refuse to sell is called the Reserve Price.

Monopolistic Competition

Monopolistic competition is a form of market structure in which a large number of independent firms are supplying products that are slightly differentiated from the point of view of buyers. Thus, the products of the competing firms are close but not perfect substitutes because buyers do not regard them as identical. This situation arises when the same commodity is being sold under different brand names, each brand being slightly different from the others.
For example − Lux, Liril, Dove, etc.
Each firm is therefore the sole producer of a particular brand or “product”. It is monopolist as far as a particular brand is concerned. However, since the various brands are close substitutes, a large number of “monopoly” producers of these brands are involved in a keen competition with one another. This type of market structure, where there is competition among a large number of “monopolists” is called monopolistic competition.
In addition to product differentiation, the other three basic characteristics of monopolistic competition are −
  • There are large number of independent sellers and buyers in the market.
  • The relative market shares of all sellers are insignificant and more or less equal. That is, seller-concentration in the market is almost non-existent.
  • There are neither any legal nor any economic barriers against the entry of new firms into the market. New firms are free to enter the market and existing firms are free to leave the market.
  • In other words, product differentiation is the only characteristic that distinguishes monopolistic competition from perfect competition.

Monopoly

Monopoly is said to exist when one firm is the sole producer or seller of a product which has no close substitutes. According to this definition, there must be a single producer or seller of a product. If there are many producers producing a product, either perfect competition or monopolistic competition will prevail depending upon whether the product is homogeneous or differentiated.
On the other hand, when there are few producers, oligopoly is said to exist. A second condition which is essential for a firm to be called monopolist is that no close substitutes for the product of that firm should be available.
From above it follows that for the monopoly to exist, following things are essential −
  • One and only one firm produces and sells a particular commodity or a service.
  • There are no rivals or direct competitors of the firm.
  • No other seller can enter the market for whatever reasons legal, technical, or economic.
  • Monopolist is a price maker. He tries to take the best of whatever demand and cost conditions exist without the fear of new firms entering to compete away his profits.
The concept of market power applies to an individual enterprise or to a group of enterprises acting collectively. For the individual firm, it expresses the extent to which the firm has discretion over the price that it charges. The baseline of zero market power is set by the individual firm that produces and sells a homogeneous product alongside many other similar firms that all sell the same product.
Since all of the firms sell the identical product, the individual sellers are not distinctive. Buyers care solely about finding the seller with the lowest price.
In this context of “perfect competition”, all firms sell at an identical price that is equal to their marginal costs and no individual firm possess any market power. If any firm were to raise its price slightly above the market-determined price, it would lose all of its customers and if a firm were to reduce its price slightly below the market price, it would be swamped with customers who switch from the other firms.
Accordingly, the standard definition for market power is to define it as the divergence between price and marginal cost, expressed relative to price. In Mathematical terms we may define it as −
L = 
(P − MC)P

Oligopoly

In an oligopolistic market there are small number of firms so that sellers are conscious of their interdependence. The competition is not perfect, yet the rivalry among firms is high. Given that there are large number of possible reactions of competitors, the behavior of firms may assume various forms. Thus there are various models of oligopolistic behavior, each based on different reactions patterns of rivals.
Oligopoly is a situation in which only a few firms are competing in the market for a particular commodity. The distinguishing characteristics of oligopoly are such that neither the theory of monopolistic competition nor the theory of monopoly can explain the behavior of an oligopolistic firm.
Two of the main characteristics of Oligopoly are briefly explained below −
  • Under oligopoly the number of competing firms being small, each firm controls an important proportion of the total supply. Consequently, the effect of a change in the price or output of one firm upon the sales of its rival firms is noticeable and not insignificant. When any firm takes an action its rivals will in all probability react to it. The behavior of oligopolistic firms is interdependent and not independent or atomistic as is the case under perfect or monopolistic competition.
  • Under oligopoly new entry is difficult. It is neither free nor barred. Hence the condition of entry becomes an important factor determining the price or output decisions of oligopolistic firms and preventing or limiting entry of an important objective.
For Example − Aircraft manufacturing, in some countries: wireless communication, media, and banking.

Pricing Strategies

Pricing is the process of determining what a company will receive in exchange for its product or service. A business can use a variety of pricing strategies when selling a product or service. The price can be set to maximize profitability for each unit sold or from the market overall. It can be used to defend an existing market from new entrants, to increase market share within a market or to enter a new market.
There is a need to follow certain guidelines in pricing of the new product. Following are the common pricing strategies −

Pricing a New Product

Most companies do not consider pricing strategies in a major way, on a day-today basis. The marketing of a new product poses a problem because new products have no past information.
Fixing the first price of the product is a major decision. The future of the company depends on the soundness of the initial pricing decision of the product. In large multidivisional companies, top management needs to establish specific criteria for acceptance of new product ideas.
The price fixed for the new product must have completed the advanced research and development, satisfy public criteria such as consumer safety and earn good profits. In pricing a new product, below mentioned two types of pricing can be selected −

Skimming Price

Skimming price is known as short period device for pricing. Here, companies tend to charge higher price in initial stages. Initial high helps to “Skim the Cream” of the market as the demand for new product is likely to be less price elastic in the early stages.

Penetration Price

Penetration price is also referred as stay out price policy since it prevents competition to a great extent. In penetration pricing lowest price for the new product is charged. This helps in prompt sales and keeping the competitors away from the market. It is a long term pricing strategy and should be adopted with great caution.

Multiple Products

As the name indicates multiple products signifies production of more than one product. The traditional theory of price determination assumes that a firm produces a single homogenous product. But firms in reality usually produce more than one product and then there exists interrelationships between those products. Such products are joint products or multi–products. In joint products the inputs are common in the production process and in multi-products the inputs are independent but have common overhead expenses. Following are the pricing methods followed −

Full Cost Pricing Method

Full cost plus pricing is a price-setting method under which you add together the direct material cost, direct labor cost, selling and administrative cost, and overhead costs for a product and add to it a markup percentage in order to derive the price of the product. The pricing formula is −
Pricing formula =
Total production costs − Selling and administration costs − MarkupNumber of units expected to sell
This method is most commonly used in situations where products and services are provided based on the specific requirements of the customer. Thus, there is reduced competitive pressure and no standardized product being provided. The method may also be used to set long-term prices that are sufficiently high to ensure a profit after all costs have been incurred.

Marginal Cost Pricing Method

The practice of setting the price of a product to equal the extra cost of producing an extra unit of output is called marginal pricing in economics. By this policy, a producer charges for each product unit sold, only the addition to total cost resulting from materials and direct labor. Businesses often set prices close to marginal cost during periods of poor sales.
For example, an item has a marginal cost of $2.00 and a normal selling price is $3.00, the firm selling the item might wish to lower the price to $2.10 if demand has waned. The business would choose this approach because the incremental profit of 10 cents from the transaction is better than no sale at all.

Transfer Pricing

Transfer Pricing relates to international transactions performed between related parties and covers all sorts of transactions.
The most common being distributorship, R&D, marketing, manufacturing, loans, management fees, and IP licensing.
All intercompany transactions must be regulated in accordance with applicable law and comply with the "arm's length" principle which requires holding an updated transfer pricing study and an intercompany agreement based upon the study.
Some corporations perform their intercompany transactions based upon previously issued studies or an ill advice they have received, to work at a “cost plus X%”. This is not sufficient, such a decision has to be supported in terms of methodology and the amount of overhead by a proper transfer pricing study and it has to be updated each financial year.

Dual Pricing

In simple words, different prices offered for the same product in different markets is dual pricing. Different prices for same product are basically known as dual pricing. The objective of dual pricing is to enter different markets or a new market with one product offering lower prices in foreign county.
There are industry specific laws or norms which are needed to be followed for dual pricing. Dual pricing strategy does not involve arbitrage. It is quite commonly followed in developing countries where local citizens are offered the same products at a lower price for which foreigners are paid more.
Airline Industry could be considered as a prime example of Dual Pricing. Companies offer lower prices if tickets are booked well in advance. The demand of this category of customers is elastic and varies inversely with price.
As the time passes the flight fares start increasing to get high prices from the customers whose demands are inelastic. This is how companies charge different fare for the same flight tickets. The differentiating factor here is the time of booking and not nationality.

Price Effect

Price effect is the change in demand in accordance to the change in price, other things remaining constant. Other things include − Taste and preference of the consumer, income of the consumer, price of other goods which are assumed to be constant. Following is the formula for price effect −
Price Effect = 
Proportionate change in quantity demanded of XProportionate change in price of X
Price effect is the summation of two effects, substitution effect and income effect
Price effect = Substitution effect − Income effect

Substitution Effect

In this effect the consumer is compelled to choose a product that is less expensive so that his satisfaction is maximized, as the normal income of the consumer is fixed. It can be explained with the below examples −
  • Consumers will buy less expensive foods such as vegetables over meat.
  • Consumers could buy less amount of meat to keep expenses in control.

Income Effect

Change in demand of goods based on the change in consumer’s discretionary income. Income effect comprises of two types of commodities or products −
Normal goods − If there is a price fall, demand increases as real income increases and vice versa.
Inferior goods − In case of inferior goods, demand increases due to an increase in the real income.

Wednesday, 23 August 2017

Demand and Supply


Demand and Supply:

                Supply and demand is perhaps one of the most fundamental concepts of economics and it is the backbone of a market economy. Demand refers to how much (quantity) of a product or service is desired by buyers. The quantity demanded is the amount of a product people are willing to buy at a certain price; the relationship between price and quantity demanded is known as the demand relationship. Supply represents how much the market can offer. The quantity supplied refers to the amount of a certain good producers are willing to supply when receiving a certain price. The correlation between price and how much of a good or service is supplied to the market is known as the supply relationship. Price, therefore, is a reflection of supply and demand.
The relationship between demand and supply underlie the forces behind the allocation of resources. In market economy theories, demand and supply theory will allocate resources in the most efficient way possible. How? Let us take a closer look at the law of demand and the law of supply.

A. The Law of Demand
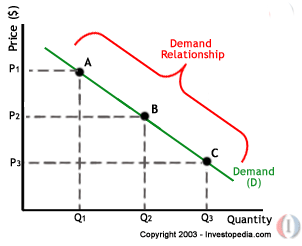
The law of demand states that, if all other factors remain equal, the higher the price of a good, the less people will demand that good. In other words, the higher the price, the lower the quantity demanded. The amount of a good that buyers purchase at a higher price is less because as the price of a good goes up, so does the opportunity cost of buying that good. As a result, people will naturally avoid buying a product that will force them to forgo the consumption of something else they value more. The chart below shows that the curve is a downward slope.

economics3.gif
A, B and C are points on the demand curve. Each point on the curve reflects a direct correlation between quantity demanded (Q) and price (P). So, at point A, the quantity demanded will be Q1 and the price will be P1, and so on. The demand relationship curve illustrates the negative relationship between price and quantity demanded. The higher the price of a good the lower the quantity demanded (A), and the lower the price, the more the good will be in demand (C).

B. The Law of Supply 
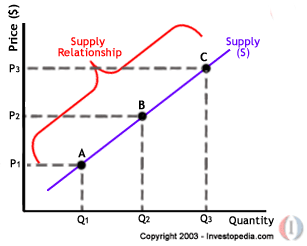
Like the law of demand, the law of supply demonstrates the quantities that will be sold at a certain price. But unlike the law of demand, the supply relationship shows an upward slope. This means that the higher the price, the higher the quantity supplied. Producers supply more at a higher price because selling a higher quantity at a higher price increases revenue.

economics4.gif
A, B and C are points on the supply curve. Each point on the curve reflects a direct correlation between quantity supplied (Q) and price (P). At point B, the quantity supplied will be Q2 and the price will be P2, and so on. 

Time and Supply

Unlike the demand relationship, however, the supply relationship is a factor of time. Time is important to supply because suppliers must, but cannot always, react quickly to a change in demand or price. So it is important to try and determine whether a price change that is caused by demand will be temporary or permanent.

Let's say there's a sudden increase in the demand and price for umbrellas in an unexpected rainy season; suppliers may simply accommodate demand by using their production equipment more intensively. If, however, there is a climate change, and the population will need umbrellas year-round, the change in demand and price will be expected to be long term; suppliers will have to change their equipment and production facilities in order to meet the long-term levels of demand.

C. Supply and Demand Relationship 
Now that we know the laws of supply and demand, let's turn to an example to show how supply and demand affect price.

Imagine that a special edition CD of your favorite band is released for $20. Because the record company's previous analysis showed that consumers will not demand CDs at a price higher than $20, only ten CDs were released because the opportunity cost is too high for suppliers to produce more. If, however, the ten CDs are demanded by 20 people, the price will subsequently rise because, according to the demand relationship, as demand increases, so does the price. Consequently, the rise in price should prompt more CDs to be supplied as the supply relationship shows that the higher the price, the higher the quantity supplied.
If, however, there are 30 CDs produced and demand is still at 20, the price will not be pushed up because the supply more than accommodates demand. In fact after the 20 consumers have been satisfied with their CD purchases, the price of the leftover CDs may drop as CD producers attempt to sell the remaining ten CDs. The lower price will then make the CD more available to people who had previously decided that the opportunity cost of buying the CD at $20 was too high.

D. Equilibrium
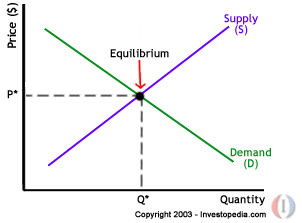
When supply and demand are equal (i.e. when the supply function and demand function intersect) the economy is said to be at equilibrium. At this point, the allocation of goods is at its most efficient because the amount of goods being supplied is exactly the same as the amount of goods being demanded. Thus, everyone (individuals, firms, or countries) is satisfied with the current economic condition. At the given price, suppliers are selling all the goods that they have produced and consumers are getting all the goods that they are demanding.

economics5.gif
As you can see on the chart, equilibrium occurs at the intersection of the demand and supply curve, which indicates no allocative inefficiency. At this point, the price of the goods will be P* and the quantity will be Q*. These figures are referred to as equilibrium price and quantity.
In the real market place equilibrium can only ever be reached in theory, so the prices of goods and services are constantly changing in relation to fluctuations in demand and supply.

E. Disequilibrium
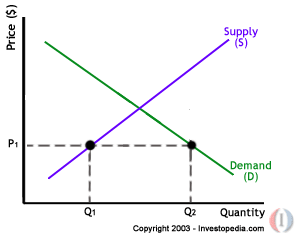
Disequilibrium occurs whenever the price or quantity is not equal to P* or Q*.
1. Excess Supply
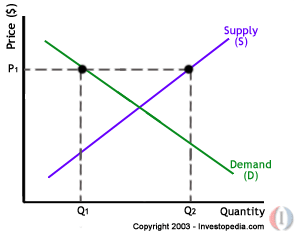
If the price is set too high, excess supply will be created within the economy and there will be allocative inefficiency.

economics6.gif
At price P1 the quantity of goods that the producers wish to supply is indicated by Q2. At P1, however, the quantity that the consumers want to consume is at Q1, a quantity much less than Q2. Because Q2 is greater than Q1, too much is being produced and too little is being consumed. The suppliers are trying to produce more goods, which they hope to sell to increase profits, but those consuming the goods will find the product less attractive and purchase less because the price is too high.
2. Excess Demand
Excess demand is created when price is set below the equilibrium price. Because the price is so low, too many consumers want the good while producers are not making enough of it.

economics7.gif
In this situation, at price P1, the quantity of goods demanded by consumers at this price is Q2. Conversely, the quantity of goods that producers are willing to produce at this price is Q1. Thus, there are too few goods being produced to satisfy the wants (demand) of the consumers. However, as consumers have to compete with one other to buy the good at this price, the demand will push the price up, making suppliers want to supply more and bringing the price closer to its equilibrium.

F. Shifts vs. Movement 
For economics, the "movements" and "shifts" in relation to the supply and demand curves represent very different market phenomena:

1. Movements
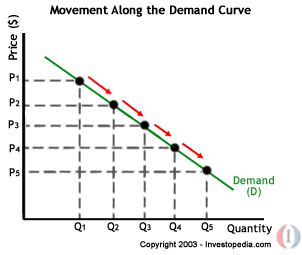
A movement refers to a change along a curve. On the demand curve, a movement denotes a change in both price and quantity demanded from one point to another on the curve. The movement implies that the demand relationship remains consistent. Therefore, a movement along the demand curve will occur when the price of the good changes and the quantity demanded changes in accordance to the original demand relationship. In other words, a movement occurs when a change in the quantity demanded is caused only by a change in price, and vice versa.

economics8.gif
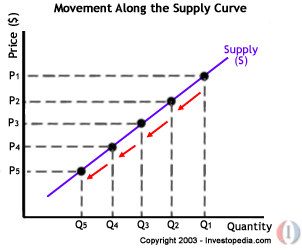
Like a movement along the demand curve, a movement along the supply curve means that the supply relationship remains consistent. Therefore, a movement along the supply curve will occur when the price of the good changes and the quantity supplied changes in accordance to the original supply relationship. In other words, a movement occurs when a change in quantity supplied is caused only by a change in price, and vice versa.

economics9.gif
2. Shifts
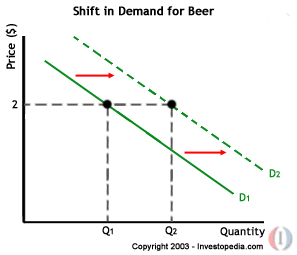
A shift in a demand or supply curve occurs when a good's quantity demanded or supplied changes even though price remains the same. For instance, if the price for a bottle of beer was $2 and the quantity of beer demanded increased from Q1 to Q2, then there would be a shift in the demand for beer. Shifts in the demand curve imply that the original demand relationship has changed, meaning that quantity demand is affected by a factor other than price. A shift in the demand relationship would occur if, for instance, beer suddenly became the only type of alcohol available for consumption.


economics10.gif
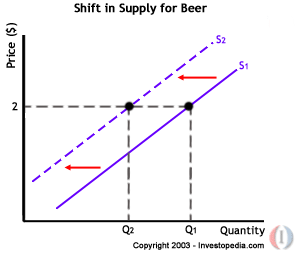
Conversely, if the price for a bottle of beer was $2 and the quantity supplied decreased from Q1 to Q2, then there would be a shift in the supply of beer. Like a shift in the demand curve, a shift in the supply curve implies that the original supply curve has changed, meaning that the quantity supplied is effected by a factor other than price. A shift in the supply curve would occur if, for instance, a natural disaster caused a mass shortage of hops; beer manufacturers would be forced to supply less beer for the same price.

economics11.gif


Demand Elasticity


Demand elasticity refers to how sensitive the demand for a good is to changes in other economic variables, such as the prices and consumer income. Demand elasticity is calculated by taking the percent change in quantity of a good demanded and dividing it by a percent change in another economic variable. A higher demand elasticity for a particular economic variable means that consumers are more responsive to changes in this variable, such as price or income.

BREAKING DOWN 'Demand Elasticity'


Demand elasticity measures a change in demand for a good when another economic factor changes. Demand elasticity helps firms model the potential change in demand due to changes in price of the good, the effect of changes in prices of other goods and many other important market factors. A grasp of demand elasticity guides firms toward more optimal competitive behavior and allows them to make more precise forecasts of their production needs. If the demand for a particular good is more elastic in response to changes in other factors, companies must be more cautions with raising prices for their goods.

Types of Demand Elasticities

One common type of demand elasticity is the price elasticity of demand, which is calculated by dividing the percent change in quantity demanded of a good by the percent change in its price. Firms collect data on price changes and how consumers respond to such changes and later calibrate their prices accordingly to maximize their profits. Another type of demand elasticity is cross-elasticity of demand, which is calculated by taking the percent change in quantity demanded for a good and dividing it by percent change of the price for another good. This type of elasticity indicates how demand for a good reacts to price changes of other goods.

Interpretation and Example of Demand Elasticity

Demand elasticity is typically measured in absolute terms, meaning its sign is ignored. If demand elasticity is greater than 1, it is called elastic, meaning it reacts proportionately higher to changes in other economic factors. Inelastic demand means that the demand elasticity is less than 1, and the demand reacts proportionately lower to changes in another variable. When a change in demand is proportionately the same as that for another variable, the demand elasticity is called unit elastic.
Suppose that a company calculated that the demand for soda product increases from 100 to 110 bottles as a result of the price decrease from $2 to $1.50 per bottle. The price elasticity of demand is calculated by taking a 10% increase in demand (10 bottles change divided by initial demand of 100 bottles) and dividing it by a 25% price decrease, producing a value of 0.4. This indicates that lowering soda prices will result in a relatively small uptick in demand, because the price elasticity of demand for soda is inelastic. Also, an increase in total revenue will be smaller in this case compared to more elastic demand for soda.

Friday, 7 July 2017

Production Cost

Production and Costs: The Theory of the Firm
The Circular Flow Model
Recall that in our initial discussion of the economy we identified two broad groups of economic actors (or units); they were households and firms. In our study of demand we looked at households as consumer units effecting demand for goods and services in the product market. On the supply side of the product market are the economic (or business) firms. They are the producers (and sellers) of goods and services. In this section we are going to look the behavior of an economic firm.

Production and Production Costs
Questions to be asked:
How do firms decide what to produce and how much to produce?
What factors constitute a firm�s costs?
How do firms determine what price(s) to charge
What determines a firm�s profit?
What determines the shape and the position of a (firm�s) supply curve?
Business Firm
A business firm is an economic unit engaged in the production of one of more economic goods or services.
Applying the technology available to it, a business firm combines economic resources (factors of production) to produce one or more goods for the purpose of making profits.
A business firm buys economic resources (inputs) and sells the goods it produces (outputs).
Production and Costs
To produce a good or a service a firm needs economic resources or factors of production. In economics,  the factors of production used by a firm in the production of a good or a service are generally referred to as inputs. What a firm produces is called output. A firm has to pay for the inputs it needs. Therefore, inputs, on the one hand, generate costs and, on the other hand, generate output.
We first study the relationship between inputs and the output; that is "production function". Then we look at the relationship between the output and costs; that is cost function.

Note: Studying the relationship between costs and inputs without regard to the output produced from the inputs is not useful. That is why we study the relationship between costs and output.
Inputs: Factors of Production
Factors of production:
The primary factors of production are land and labor.
Capital is another important factor of production.
In economics we distinguish between physical capital and financial capital.
Physical capital: tools,  machinery, equipment, buildings
Note: Non-physical assets such as copy rights and patent rights are functionally similar to physical capital.
Financial capital: Financial assets representing physical capital (stocks) or used to acquire physical capital are financial capital.
In addition to land, labor and capital businesses often use intermediate goods (raw materials and supplies) in the production process.
Entrepreneurial Services: In market economies the function of entrepreneurs is also very important. The function of an entrepreneur is to acquire and combine all the needed factors of production to produce a good. An entrepreneur takes chances (risks) in the hope of making profits.
Cost of production is simply the sum of the costs of all inputs used in production.
Production Costs = Costs of Inputs
Production in the Short Run versus Production in the Long Run
In the theory of the firm the distinction between short run and long run is not necessarily based on the length of time. It is rather based on the degree of the variability of inputs.
In the short run at least one of the factors of production remains unchanged (fixed).
In the long run all factors of production are variable.
In a two-input production process, in the short run, only one input is variable.
In a two-input production model, in the short run, the changes in the output (physical product) are the result of changes in the variable input.
Production in the Long Run
In the long run all inputs used in the production process by the firm are variable.
In a two-input production model, in the long run, both inputs (say, capital and labor) are variable.
In the long run the level of the output of a firm can change as a result of changes in any or all inputs.
A Short-Run Production (Function) Analysis
Our model:
A firm using two inputs:
Capital (K); Fixed Input
Labor (L);    Variable input
We examine the relationship between the variable
input (labor) and the output.
We examine how changes in labor (the variable input)
affect the out put.

Output Measures
Total (Physical) Product (output), TPP: The total amount of output produced by the firm over a certain period
Average (Physical) Product (of the variable input), APP: Total (Physical) Product divided by the number units of the variable input
Marginal (Physical) Product (of the variable input), MPP: The change in total product resulting from employing one additional unit of the variable input


Average (Physical) Product and Marginal Physical Product


                                                             Change in  TPP
Marginal Physical Product =  MPP =   ---------------------
                                                             Change in V. Input
                                                           Total Physical Product
Average Physical Product = APP =    -------------------------
                                                                Total V. Input

The �Law� of Diminishing Return
Increases in the amount of any one input, holding the amounts all other inputs constant, would eventually result in decreasing marginal product of the variable input.
Explanation: Unless all inputs are perfectly and infinitely substitutable, as we increase the amount of one input, while keeping other inputs constant, at some point the productive effectiveness of that input starts to decline.

Output and the Firm�s Revenue
Total Revenue (TR) = Price x Total P. Product
Marginal Revenue Product: The change (increase) in revenue resulting from the output produced by one additional unit (MPP) of the variable input
                   MRP = MPP x Price


Optimal Input Level:
Input Price = MRP
Wage = $5
Optimal Input= 7
Optimal Output =60
Optimal Input/Output


Plotting the Cost Measures


                     K= 10                                            K= 20                                               K= 30


Return to Scale


Optimal Input Combinations
Recall that in our short-run analysis to decide how many units of labor to employ we equalized the revenue resulted from hiring one additional unit of labor (MRP) and the price of labor (wage).
   This rule can be generalized and applied to all inputs.
        MPP *  PRICE  =  MRPL  =   Wage
      MPPK * PRICE =   MRPK  =   Price of Capital

Marginal Product and the Input Price
Each time a firm wants to increase its  output it would have to buy (hire) additional inputs.
Additional input generates costs, on the one hand, and generates output, on the other hand.
If the inputs are added one unit at a time,
            Change in cost = the price of input
                Change in output = MPP
The cost of each additional unit of out put will be:
 Change in cost           or                Input Price
Change in output                               MPP
MPP, Input Price and Marginal Cost
Recall our definition for marginal cost:
                      Change in Cost
     MC    =  -------------------
                    Change in Output
When we increase our input one input/one unit at a time:
                                         Change in cost  =  Input price
                                        Change in Output = MPP
Choosing the Optimal Mix of Inputs
One approach to choosing the optimal (least costly) mix of inputs is to compare the (marginal) cost of producing one extra unit of out put across different inputs.
The firm would likely use the input that increases its output at the lowest cost by comparing
Input Price
    --------------       across all available inputs.
       MPP

Friday, 16 June 2017

Introduction to Economics


Introduction:

Economics is a field of study that has become increasingly relevant in our globalized, financialized society. The economy is part of our collective conscious and a buzzword that links personal finances to big business and international trade deals. Economics deals with individual choice, but also with money and borrowing, production and consumption, trade and markets, employment and occupations, asset pricing, taxes and much more. What then is the definition of economics? One way to think of it is the study of what constitutes rational human behavior in the endeavor to fulfill needs and wants given a world with scarce resources. In other words, economics tries to explain how and why we get the stuff we want or need to live. How much of it do we get? Who gets to have more? Who makes all this stuff? How is it made? These are the questions and decisions that economics concerns itself with.


As an individual, for example, you constantly face the problem of having limited resources with which to fulfill your wants and needs. As a result, you must make certain choices with your money – what to spend it on, what not to spend it on, and how much to save for the future. You'll probably spend part of your paycheck on relative necessities such as rent, electricity, clothing and food. Then you might use the rest to go to the movies, dine out or buy a smartphone. Economists are interested in the choices you make, and investigate why, for instance, you might choose to spend your money on a new Xbox instead of replacing your old pair of shoes. They would want to know whether you would still buy a carton of cigarettes if prices increased by $2 per pack. The underlying essence of economics is trying to understand how individuals, companies, and nations as a whole behave in response to certain material constraints.
Adam Smith (1723 - 1790), is often considered the "father of modern economics." His book "An Inquiry into the Nature and Causes of the Wealth of Nations" (1776) was the first fully elaborated attempt to understand why some nations prospered while others suffered widespread poverty. He famously argued that individuals working for their own self-interest could nonetheless create a stable and well-provisioned society through a mechanism he called  the invisible hand of the market. (See also: 'Adam Smith and 'The Wealth Of Nations.')
Smith, however, was not the first to write on economic matters. Other scholars of what was then known as political economy wrote prior to "The Wealth of Nations," but Adam Smith was one of the first to identify the unique economic changes that accompanied the birth of industrialization and capitalist production. Smith’s work was followed by David Ricardo’s "Principles of Political Economy and Taxation" (1817) and later by Karl Marxin "Capital" (1867). Each of these authors sought to explain how capitalism worked and what it meant for producers and workers in the capitalist system. (See also: What is the difference between Communism and Socialism?)
In the late 19th century, the discipline of economics became its own distinct field of study. Alfred Marshall, author of "The Principles Of Economics" (1890) defined economics as a social science that examines people's behavior according to their individual self-interests. He wrote, "Thus it is on one side the study of wealth; and on the other, and more important side, a part of the study of man." In the early 20th century, however, there was a push toward legitimizing economics as a rigorous science alongside the physical sciences like chemistry and physics. As a result, mathematical models and statistical methods were brought to the forefront along with a number of strong assumptions that are needed to make those models work. For example, modern mainstream economics makes the assumption that human beings will always aim to fulfill their individual self-interests. It also assumes that individuals are rational actors in their efforts to fulfill their unlimited wants and needs. It also makes the claims that firms exist to maximize profit and that markets are efficient. This school of economics, which has come to dominate both the academic field of economics as well as the practical application of economic theory in policy and business, is known as neoclassical economics.


Kinds of Economic Systems:

Traditional Economic System


The traditional economic system is the most traditional and ancient types of economies in the world. Vast portions of the world still function under a traditional economic system. These areas tend to be rural, second- or third-world, and closely tied to the land, usually through farming. In general, in this type of economic system, a surplus would be rare. Each member of a traditional economy has a more specific and pronounced role, and these societies tend to be very close-knit and socially satisfied. However, they do lack access to technology and advanced medicine.

Command Economic System


In a command economic system, a large part of the economic system is controlled by a centralized power. For example, in the USSR most decisions were made by the central government. This type of economy was the core of the communist philosophy.
Since the government is such a central feature of the economy, it is often involved in everything from planning to redistributing resources. A command economy is capable of creating a healthy supply of its resources, and it rewards its people with affordable prices. This capability also means that the government usually owns all the significant industries like utilities, aviation, and railroad.
railroad in a command economy
In a command economy, it is theoretically possible for the government to create enough jobs and provide goods and services at an affordable rate. However, in reality, most command economies tend to focus on the most valuable resources like oil.

Advantages of Command Economic Systems

  • If executed correctly, the government can mobilize resources on a massive scale. This mobility can provide jobs for almost all of the citizens.
  • The government can focus on the good of the society rather an individual. This focus could lead to a more efficient use of resources.

Disadvantages of Command Economic Systems

  • It is hard for the central planners to provide for everyone’s needs. This forces the government to ration because it cannot calculate demand since it sets prices.
  • There is a lack of innovation since there is no need to take any risk. Workers are also forced to pursue jobs the government deems fit.

 Market Economic System


In a free market economy, firms and households act in self-interest to determine how resources get allocated, what goods get produced and who buys the goods. This is opposite to how a command economy works, where the central government gets to keep the profits.
There is no government intervention in a pure market economy (“laissez-faire“). However, no truly free market economy exists in the world. For example, while America is a capitalist nation, our government still regulates (or attempts to control) fair trade, government programs, honest business, monopolies, etc.
In this type of economy, there is a separation of the government and the market. This separation prevents the government from becoming too powerful and keeps their interests aligned with that of the markets.
Hong Kong has been seen as an example of a free market society.

Advantages of a Free Market Economy

  • Consumers pay the highest price they want to, and businesses only produce profitable goods and services. There is a lot of incentive for entrepreneurship.
  • This leads to the most efficient use of the factors of production since businesses are very competitive.
  • Businesses invest heavily in research and development. There is an incentive for constant innovation as companies compete to provide better products for consumers.

Disadvantages of a Free Market Economy

  • Due to the fiercely competitive nature of a free market, businesses will not care for the disadvantaged like the elderly or disabled. This leads to higher income inequality.
  • Since the market is driven solely by self-interest, economic needs have a priority over social and human needs like providing healthcare for the poor. Consumers can also be exploited by monopolies.

Mixed Economic System


A mixed economy is a combination of different types of economic systems. This economic system is a cross between a market economy and command economy. In the most common types of mixed economies, the market is more or less free of government ownership except for a few key areas like transportation or sensitive industries like defense and railroad.
However, the government is also usually involved in the regulation of private businesses. The idea behind a mixed economy was to use the best of both worlds – incorporate policies that are socialist and capitalist.
To a certain extent, most countries are mixed economic system. For example, India and France are mixed economies.

Advantages of Mixed Economies


  • There is less government intervention than a command economy. This means that private businesses can run more efficiently and cut costs down than a government entity might.
  • The government can intervene to correct market failures. For example, most governments will come in and break up large companies if they abuse monopoly power. Another example could be the taxation of harmful products like cigarettes to reduce a negative externality of consumption.
  • Governments can create safety net programs like healthcare or social security.
  • In a mixed economy, governments can use taxation policies to redistribute income and reduce inequality.

Disadvantages of Mixed Economies

  • There are criticisms from both sides arguing that sometimes there is too much government intervention and sometimes there isn’t enough.
  • A common problem is that the state run industries are often subsidized by the government and run into large debts because they are uncompetitive.

Production Possibility Frontier


production–possibility frontier (PPF) or production possibility curve (PPC) is the possible tradeoff of producing combinations of goods with constant technology and resources per unit time. One good can only be produced by diverting resources from other goods, and so by producing less of them. This tradeoff is usually considered for an economy, but also applies to each individual, household, and economic organization.
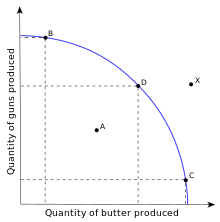
Graphically bounding the production set for fixed input quantities, the PPF curve shows the maximum possible production level of one commodity for any given production level of the other, given the existing state of technology. By doing so, it defines productive efficiencyin the context of that production set: a point on the frontier indicates efficient use of the available inputs (such as points B, D and C in the graph), a point beneath the curve (such as A) indicates inefficiency, and a point beyond the curve (such as X) indicates impossibility.
The PSU represented by the point on the PPF where an efficient economy operates (which is obtained by tangency with the highest individual or social indifference curve, not shown in the graph) presents the priorities or choices of the modeled agent, such as the choice of having more butter produced and fewer guns, or vice versa.
An example PPF with illustrative points marked
PPFs are normally drawn as bulging upwards or outwards from the origin ("concave" when viewed from the origin), but they can be represented as bulging downward (inwards) or linear (straight), depending on a number of assumptions. A PPF illustrates several economic concepts, such as scarcity of resources (the fundamental economic problem that all societies face), opportunity cost (or marginal rate of transformation), productive efficiency, allocative efficiency, and economies of scale.
An outward shift of the PPF results from growth of the availability of inputs, such as physical capital or labour, or from technological progress in knowledge of how to transform inputs into outputs. Such a shift reflects, for instance, economic growth of an economy already operating at its full productivity (on the PPF), which means that more of both outputs can now be produced during the specified period of time without sacrificing the output of either good. Conversely, the PPF will shift inward if the labor force shrinks, the supply of raw materials is depleted, or a natural disaster decreases the stock of physical capital.
However, most economic contractions reflect not that less can be produced but that the economy has started operating below the frontier, as typically, both labor and physical capital are underemployed, remaining therefore idle.